


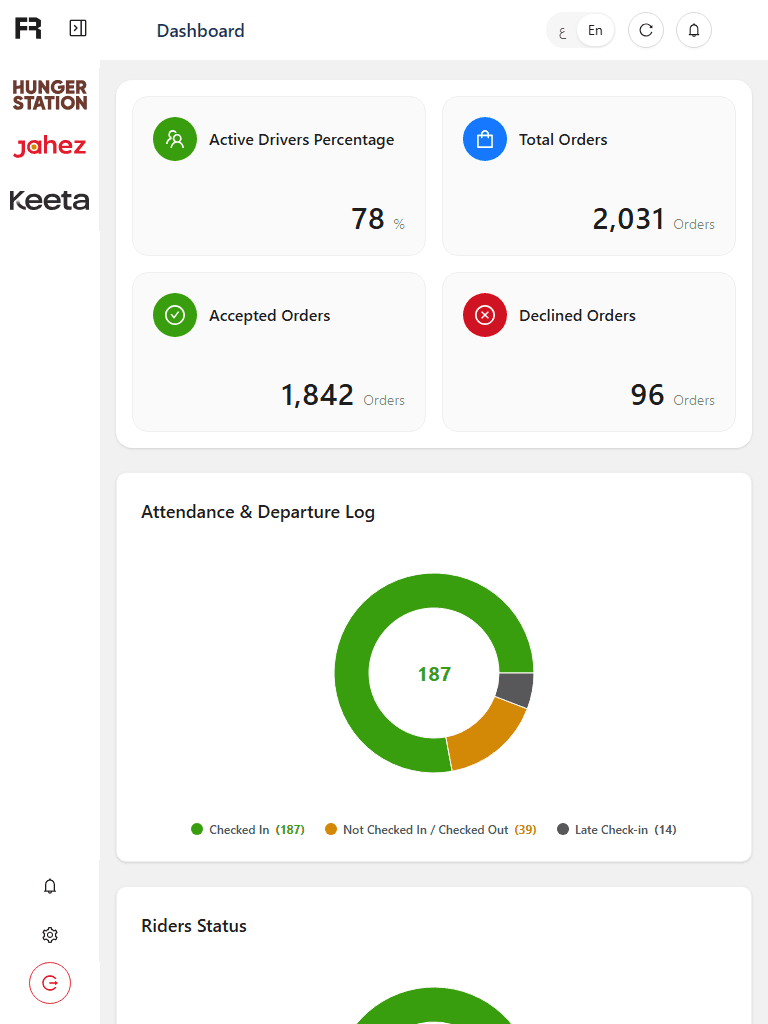

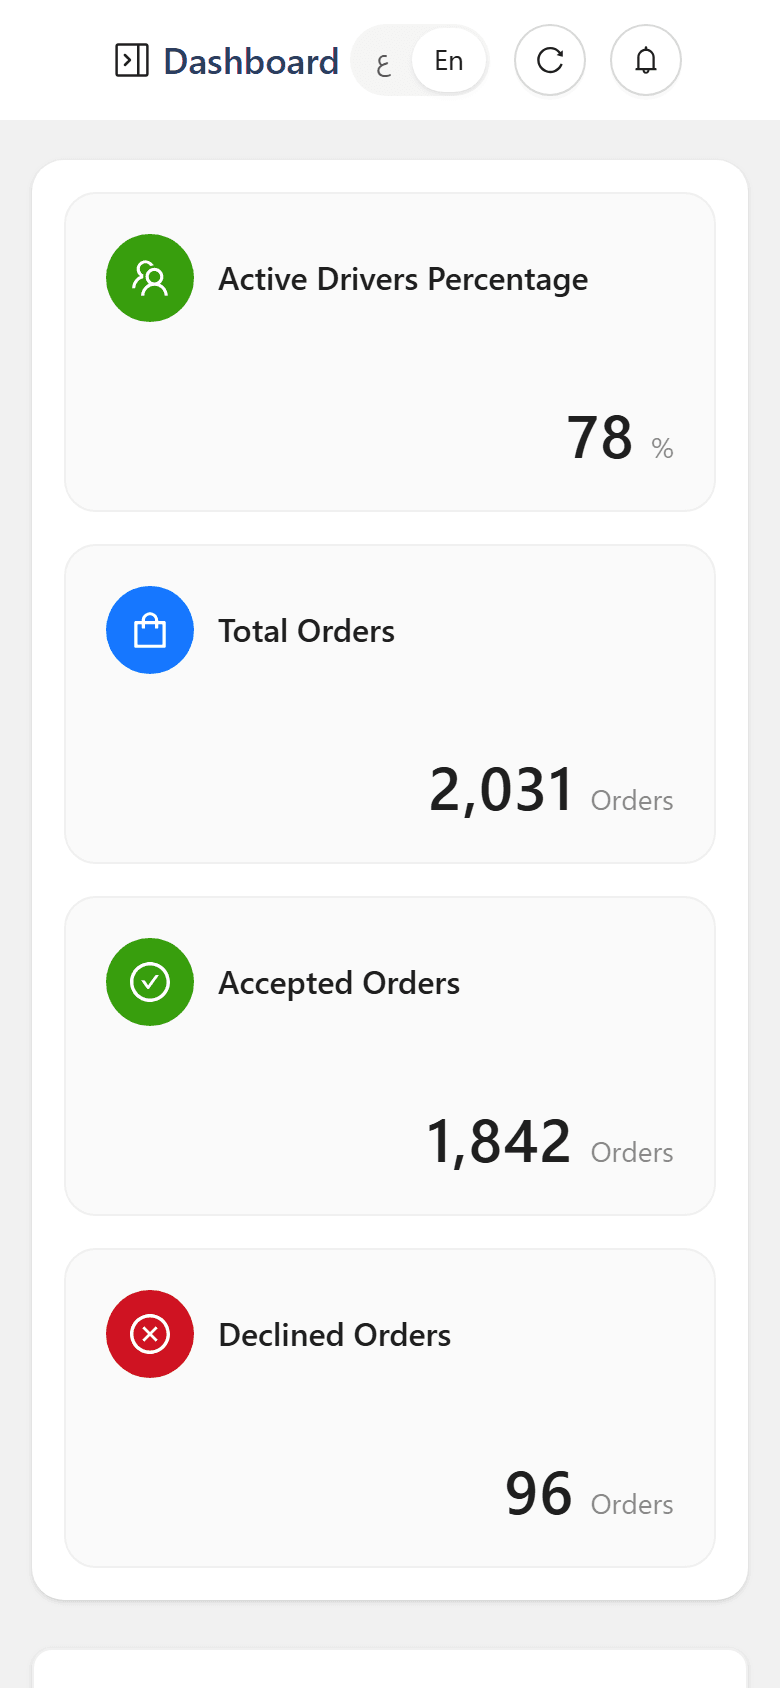
One Console, Three Platforms
Jahez, HungerStation and Keeta share a single shell. The sidebar, routes and default landing page are built from each organisation’s access, so users only see the platforms they run.
Fig. 01
Desktop · Laptop · Tablet · Phone
Rabeh is an internal operations dashboard for companies that run delivery fleets on several last-mile platforms at once. Dispatchers used to jump between separate back offices for Jahez, HungerStation and Keeta to see who is working, who is idle and who owes cash. Rabeh puts all three behind one login, one sidebar and one consistent set of reports — with Excel export, Arabic/English (RTL) support and per-organisation access control.
This case study covers the front-end rewrite: a typed, feature-sliced React codebase that replaced a large legacy app, with every report page code-split and a shared set of table, filter and chart components.
Ahmed Mamdouh
Contributor
Muhammad Allam
Contributor
Core Features
Jahez, HungerStation and Keeta share a single shell. The sidebar, routes and default landing page are built from each organisation’s access, so users only see the platforms they run.
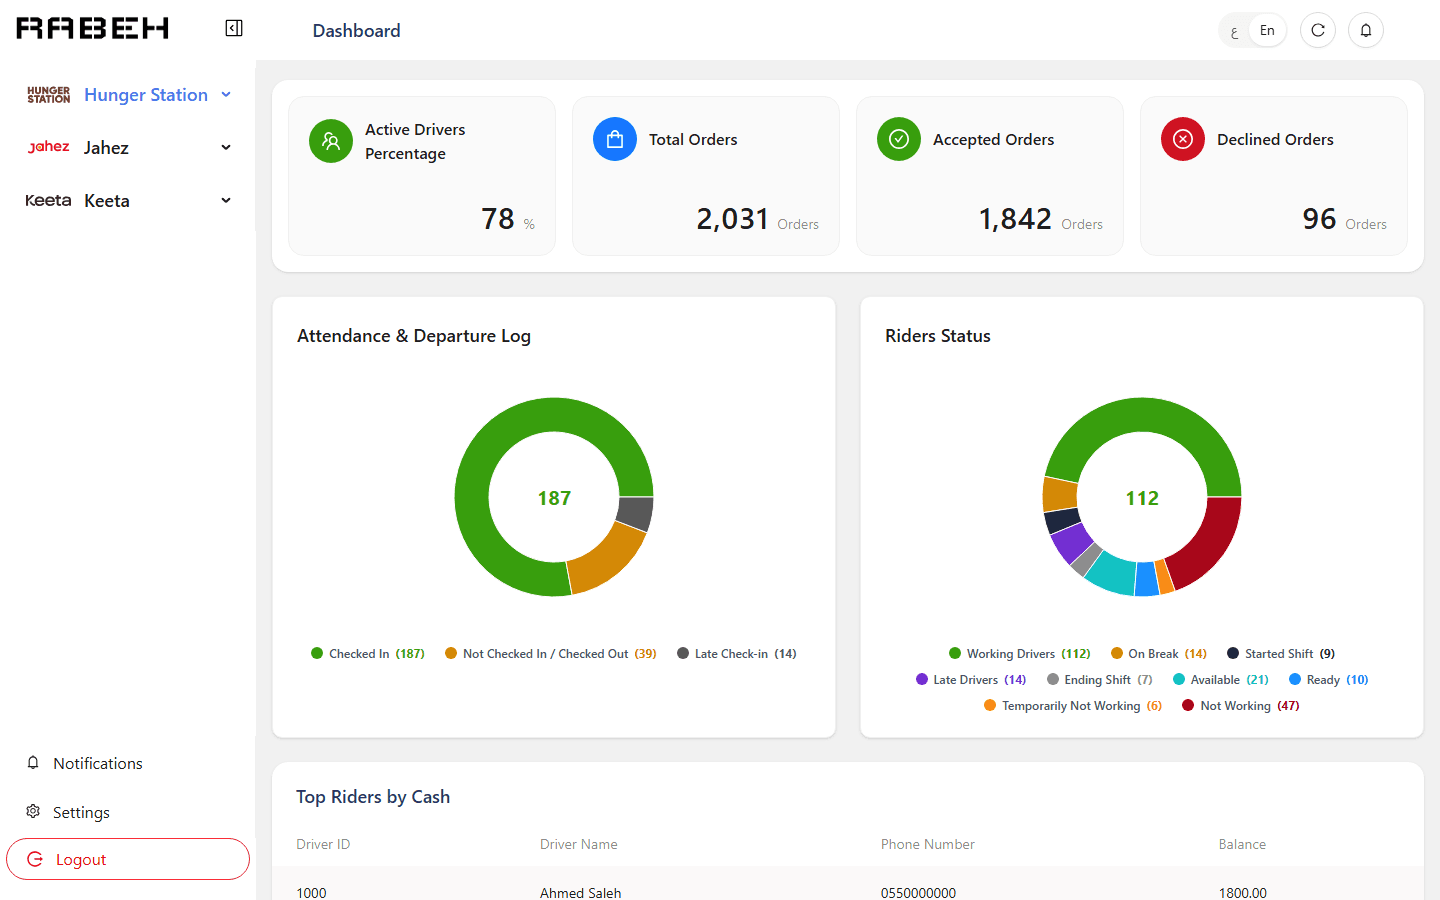
Attendance, rider status and order acceptance at a glance. Donut charts are clickable — tap a status to open the exact list of riders behind the number.
Server-paginated tables with composable filters (rider, date range, city, cash balance) and a one-click export that reuses the active filters.
Full translation files for both languages. Direction, sidebar side and chart legends flip with the language, and the choice is remembered.
Admins, per-platform specialities, permission codes and organisation feature flags are checked by one guard, used by both the router and the menu.
Edit driver details inline and manage car rent, sponsorship fees, commissions, debt, fuel, daily targets and alternative drivers from modals.
Every report page is its own lazy chunk, so the first load only ships the shell and the page you open.
Dashboard
The HungerStation landing page: active-driver percentage, total / accepted / declined orders, attendance and rider-status donuts, and the ten riders holding the most cash. Each donut slice drills down into the riders behind it.
Reports
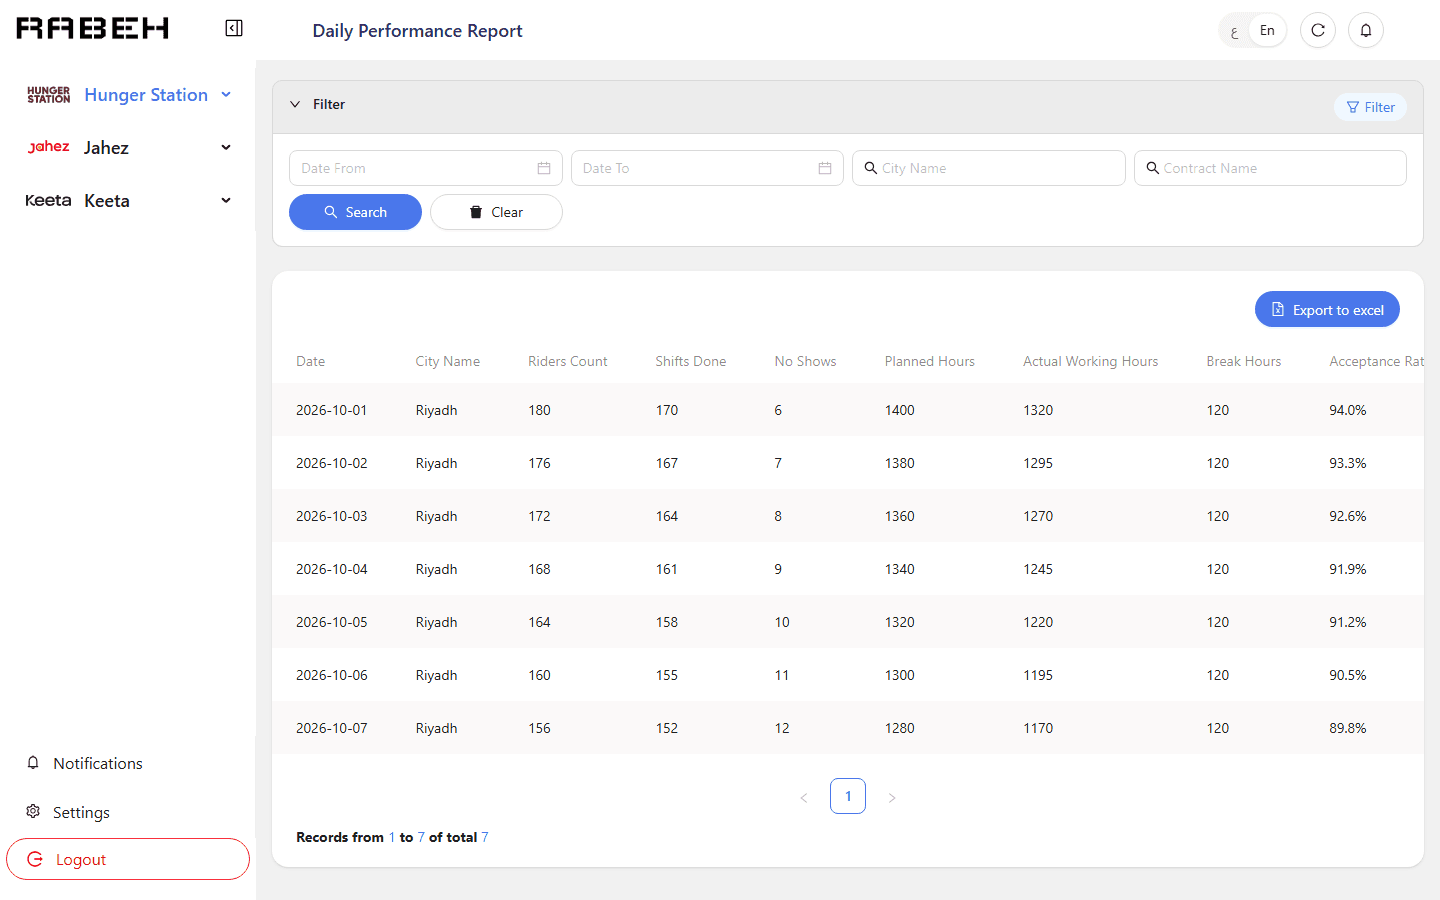
A paginated report of shifts, planned versus actual hours, acceptance rate and delivery counts per city and day. Filters sit above the table and the Excel export honours whatever is applied.
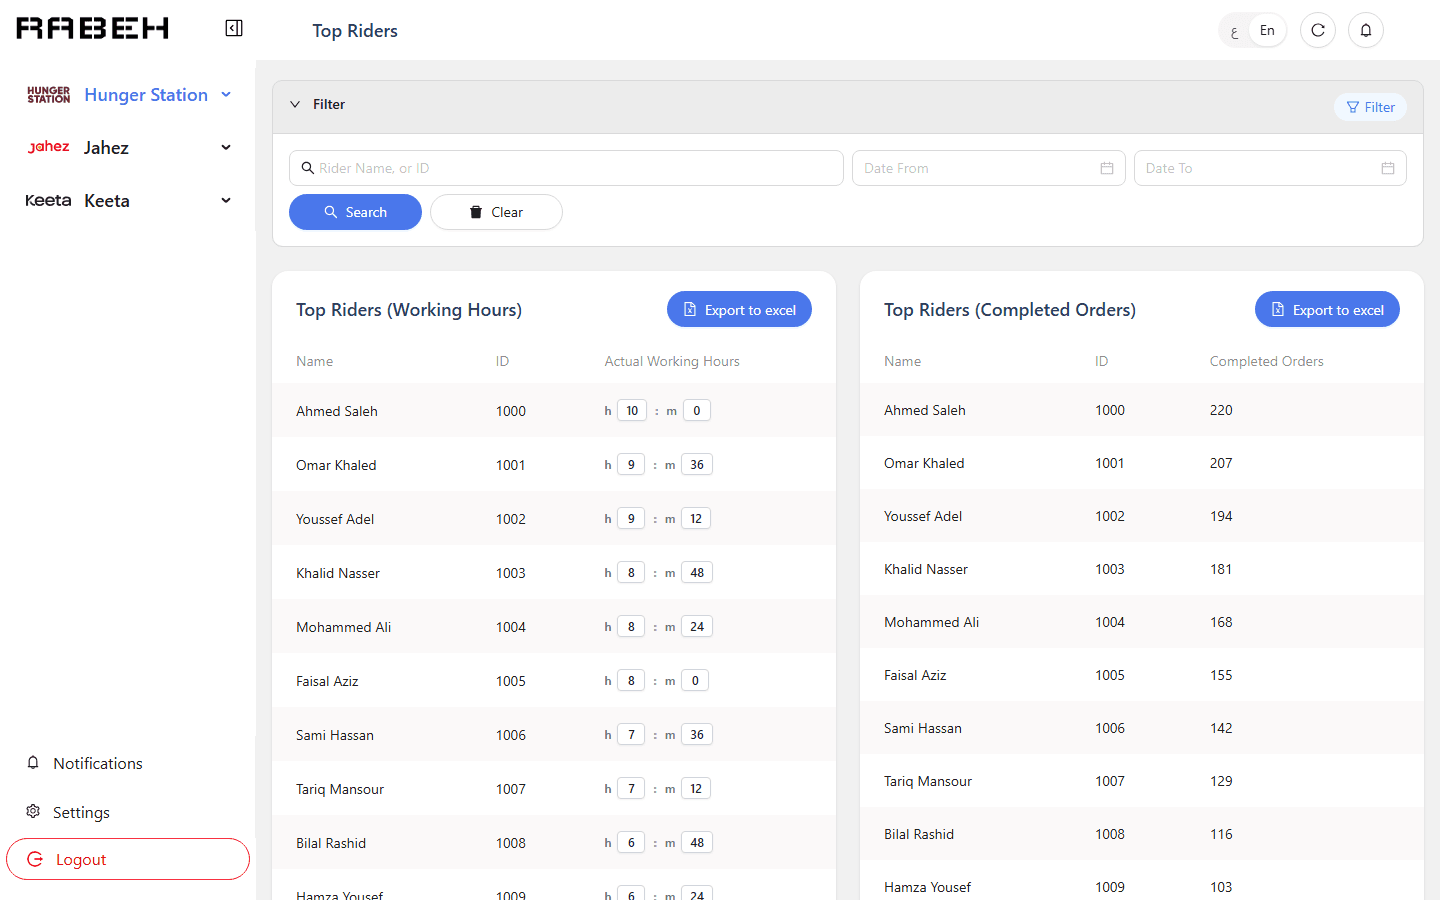
Rankings
Two leaderboards side by side — by working hours and by completed deliveries — sharing one filter bar. Working hours are shown as h:m cells so decimal hours never get misread.
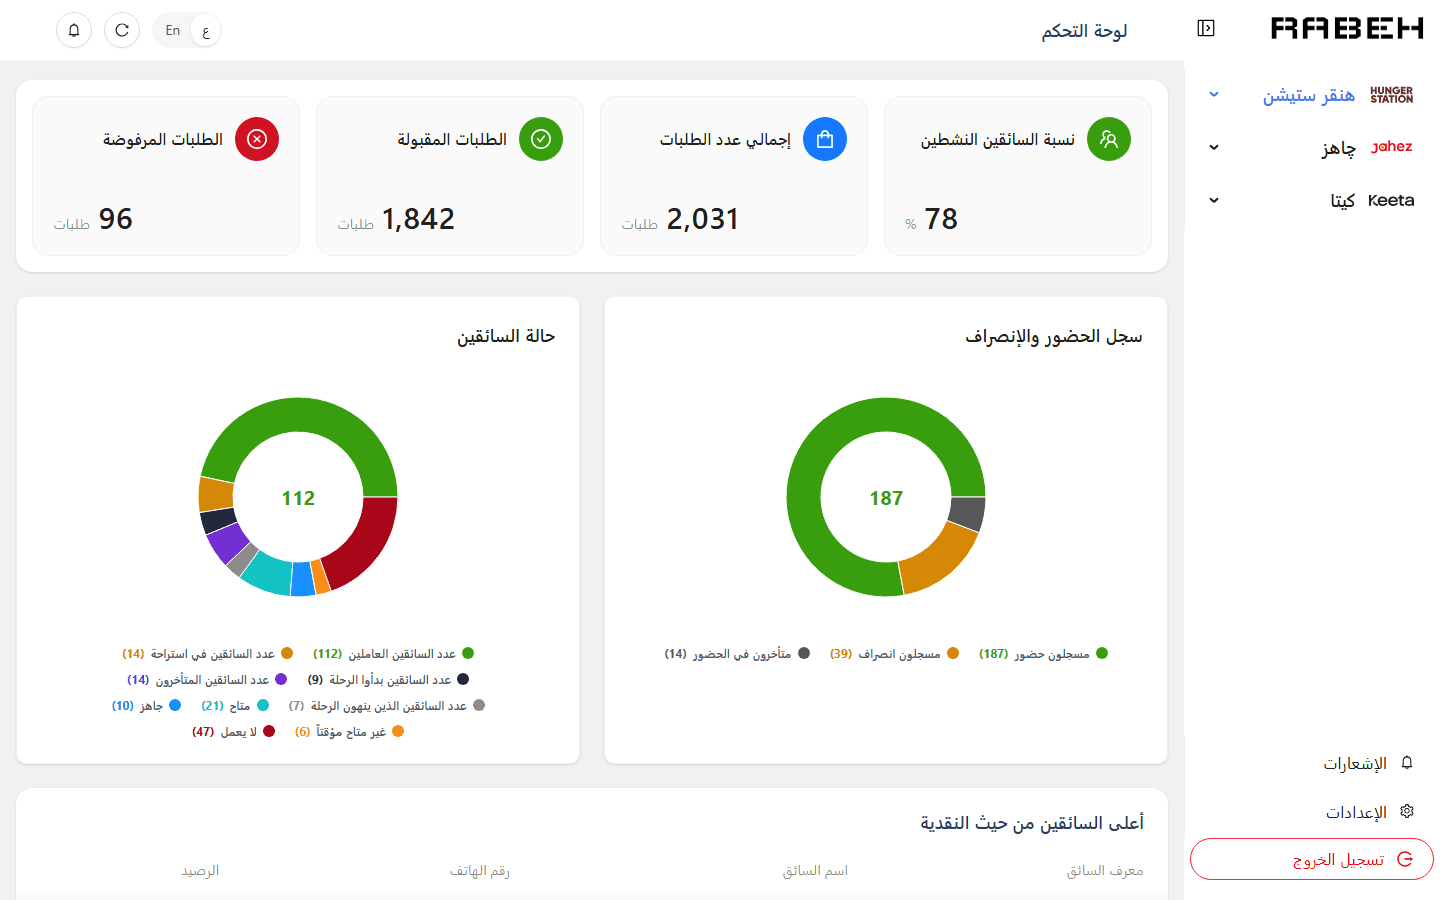
Localisation
Switching to Arabic mirrors the whole app: the sidebar moves to the right, the header controls swap sides and chart legends re-flow — from the same components, without a separate RTL stylesheet.
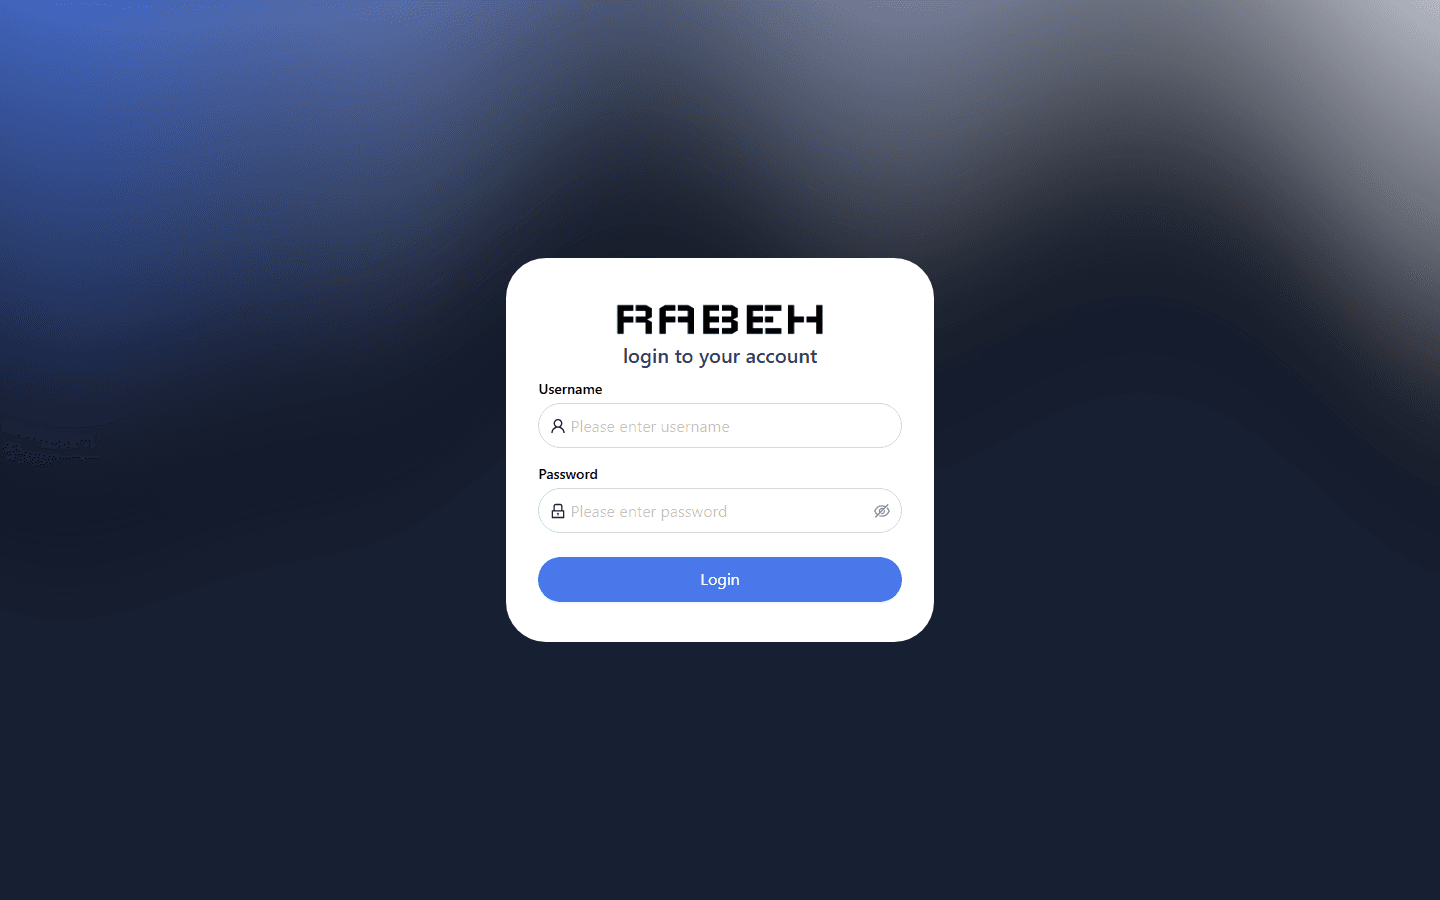
Access
A minimal login that decides everything after it: the response sets the user’s role, platforms, permissions and feature flags, and the router builds the menu from them.
The problem
The solution
Instead of scattering role checks through pages, every route carries an access rule (platform, permission code, feature flag) and a single guard evaluates it for both the router and the sidebar. The default landing page is also derived from what the user can open, so nobody lands on a page they cannot see.
The problem
The solution
List endpoints answer with arrays, `results`, `data`, `riders` or named keys, and some return HTTP 200 with an internal 500 status code. A small normaliser turns every list into the same `{ records, total }` shape, and a shared report factory builds the fetch + Excel pair for each page.
The problem
The solution
Pages are lazy-loaded one by one, server state lives in TanStack Query with centralised query keys (so the header reload button knows what to refresh), and tables, filters, stat cards and donut charts are shared components rather than per-page copies.
0
Delivery platforms unified
0
Report pages
0
Languages with RTL
0
Commits in the rewrite